User Tools

Site Tools


setups:topology:home

Network Topology

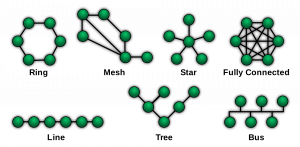
Network Topology is the arrangement of the elements (links, nodes, etc.) of a communication network.

Each have their pros and cons.

Current Topology

As of Nov 6, 2022, our network topology looks like this:

BC Nodes are on the left, Alberta and other nodes are on the right.

Hovering over the picture will bring up a control panel:

  • The left and right arrow navigates between different pages.
  • The - and + signs are to zoom out and in.
  • The last icon is to export the chart as an image.

About the Diagram

There was three steps in creating the diagram above:

  1. Create a text file of the topology using a python script (quick)
  2. Import that text file into https://app.diagrams.net (quick)
  3. Format it (not quick)

Python Script

This Python script loads every mesh status pages on a given network and builds the list of connected nodes. All four .py files should be located in the same folder.

aredn_topology.py maps the topology of the network.
aredn_speedtest.py measures the time it takes to load each page.
read_pages.py functions needed to read the mesh status pages.
write_files.py functions needed to write the output files.

The scripts output these text files:

aredn_topology.py:
Diagrams.net.txt can be inputted into https://www.diagrams.net (AKA draw.io)
Flowchart.fun.txt can be inputted into https://flowchart.fun
Human_Readable_List.txt is an easy to read list of all stations and who they're connected to.
Topology.csv is a spreadsheet view of each connection.
aredn_speedtest.py:
Download_Times.csv is a spreadsheet with the times it took to load each page.

The latest version (Dec 20) loads a maximum of 30 pages at a time, which was found to minimize the overall download time. Individual pages have a timeout period of one minute so the script can take anywhere from 9 seconds to 60 seconds to complete.

The table below shows the speed of the script depending on the number of concurrent downloads.

  • Total Run Time is the time it actually took the script to finish.
  • Sum of Individual Times is the time that each page took to load all added up together.
  • Average Time per Page is the time each page took to load on average.
Concurrent Downloads Total Run Time (s) Sum of Individual Times (s) Average Time per Page (s)
1 213.4 172.5 2.1
2 104.2 164.6 2.0
5 42.2 166.1 2.0
10 22.1 170.7 2.0
20 13.1 186.6 2.2
25 12.1 208.6 2.5
28 9.1 183.4 2.2
30 9.1 182 2.2
32 9.1 180 2.1
35 13.1 195.7 2.3
40 12.1 236.5 2.8
45 16.1 264.4 3.1
50 16.1 309 3.7
60 15.1 320.9 3.8
70 17.1 350.9 4.2

Notice that when downloading more than 10 pages at once, each individual page takes a little longer to load (maybe because of total bandwidth or CPU limitation), but the minimum total run time was with around 30 downloads. Another problem also arises when the number of download is greater than 70: some pages simply don't load (maybe because of CPU or memory limitation).

Patrick, VA7FI 2021/12/14 20:08

diagrams.net AKA draw.io

From diagrams.net:

diagrams.net (previously draw.io) is a free and open source cross-platform graph drawing software developed in HTML5 and JavaScript.

diagrams.net is available as online as cross-browser web app, and as offline desktop application for Linux, macOS, and Windows. The web app does not require online login or registration, and can open from and save to the local hard drive.

To create a chart from the output of the python script:

  • Select Save diagrams to: Device
  • Create New Diagrams
  • Create a Blank Diagram
  • Click the + sign in the tool bar at the top
  • Select AdvancedFrom Text…
  • Select Diagram instead of List
  • Replace the example with the output from the script and click Insert
  • Click EditSelect Edges
  • On the right hand side, replace the arrows by lines.
setups/topology/home.txt · Last modified: 2022/11/06 07:38 by va7fi